Saturday, May 12, 2012

MSFT A Good Time to Buy

MSFT stock chart from Freestockcharts.com
MSFT (Microsoft) has recently setup in a good buy area. MSFT has been on a steady incline since November 2011 and has come down to a nice level this week. Stochastics and RSI have crossed to the upside indicating this stock is ready to show some strength. MACD is still horizontal but looks like it'll soon turn up. MSFT is above the 200 day moving average, but below the 20 and 50 day moving average; it's really close to make a cross above soon. Parabolic SAR is indicating there is still a downtrend and Bollinger bands are getting tighter. We may still see some sideways movement before it starts going higher an maybe even a small pull back from Friday's nice move up. If it decides to pull back we may see it come down somewhere between $30.50 and $30.20. The upside of MSFT can be really rewarding, with a short term price target of $33, and analysts have placed a 12 month price target of $37.

If that doesn't get you excited, MSFT also pays its investors a 2.57% dividend yield, that's $.20 per stock each quarter. Microsoft also owns a small share of Facebook, about 1.6% or $1.36 billion. With Facebook's upcoming IPO on May 18th, lots of people are going to try to get in on the action. There's a pretty good chance that FB (Facebook) will do well in the future, which could positively impact Microsoft's stock. Good luck and happy trading!

New article on stock ticker symbol NVDA.
New article on stock ticker symbol LVS.
New article on stock ticker symbol LUXR.
New article on stock ticker symbol AMRN.
New article on stock ticker symbol OC.

Follow me on Twitter!

Friday, May 11, 2012

NVDA Ripped today!

NVDA stock chart from Freestockcharts.com
Today NVDA (Nvidia) reported their Q1 earnings and when looking at the chart above it's obvious they did good. NVDA did better than expected by analysts, their sales for Q1 came in at $925 million while analysts were expecting $916 million. I'm still surprised as to why this stock is still so cheap with all of those smart phones and tablets rocking Nvidia tegra chips. When the mobile gaming industry picks up, we may see more action with Nvidia as they are a leader in video and graphics.

In the chart we can see a definite trend going on. I have the lower and upper trend lines drawn in to show that the price of this stock has been bouncing in this small channel for about 3 months. It is currently in a down trend, but that may soon change. With the recent momentum thrown back into this stock today we may just see a break above the $14.10 ceiling, and if that does happen we might just be in a new uptrend. Stochastics, MACD and RSI are showing positive signs that this stock should be headed north. Once it gets back up the $14.10 area, you may want to take some profits; it may go back down from there, but there's a good chances it'll go higher. Bollinger Bands are okay, and the Parabolic SAR is showing a new uptrend.

If the $14.10 area is crossed, expect NVDA to break resistance and start a new uptrend. Make sure you take profits and have a stop loss set. Good luck and happy trading!


New article on stock ticker symbol LVS.
New article on stock ticker symbol LUXR.
New article on stock ticker symbol AMRN.
New article on stock ticker symbol OC.


Follow me on Twitter!    

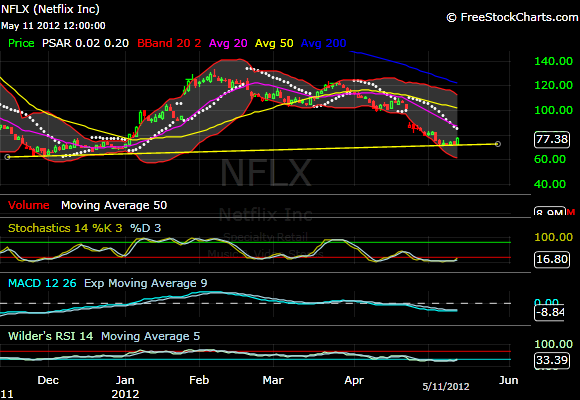
NFLX Possible Double Bottom Reversal?

NFLX chart from Freestockcharts.com
Today NFLX (Netflix) had a really great day, it traded as low as $72.49, as high as $78.39 and closed at $77.38. That's a pretty good pop if you ask me. Now we all know this stock hasn't been given any love and has been declining for the last year. In the chart you can see the Stochastics, MACD and RSI  are just about crossing to the upside, meaning this stock can move up even higher soon. Another thing that strikes me about NFLX is the fact that it just did a double bottom. I know that it's not a perfectly straight line as it should be to have a confirmed double bottom, but it's pretty close. All this means is that this stock could reach the mid hundreds soon and that's obviously a good thing! Only thing that concerns me is the Bollinger Bands and the Parabolic SAR, they both still say downtrend to me. Other than that, this stock is looking ready to buy. 

This could be the turn around for this stock to get it back on its path to $300. Let's not get too crazy though, for the short term we can see a future conservative stock price of $100 and a riskier price of $150. Good luck and happy trading!

What do you think, can Netflix turn their business back around?


New article on stock ticker symbol NVDA.
New article on stock ticker symbol LVS.
New article on stock ticker symbol LUXR.
New article on stock ticker symbol AMRN.
New article on stock ticker symbol OC.


Follow me on Twitter!

Thursday, May 10, 2012

OC Good Entry Point

Chart provided by http://www.freestockcharts.com
OC (Owens Corning) specializes in glass fiber material and makes homes more energy efficient. OC has come down to the lower trend line on May 9th and may turn the current stock price to the upside. It has been consolidating for the past two weeks and the bollinger bands are starting to look too skinny. They need to widen out a bit, meaning the stock price should go higher. The Parabolic SARs claim there is a current uptrend present. Stochastics, MACD and RSI aren't showing oversold levels yet, they are at their mid point. With the confirmed lower trend line present, we can expect a bounce off of it, with the stock price reaching as high as $40. This is still a risky play, I would much rather see Stochastics and MACD line up with the lower trend line. But if we see a cross in Stochastics and MACD within the next two trading days, I would say we have a confirmed a price rise towards $40.
Estimates from Fidelity.com


From the Fidelity.com estimates page for OC we can see that Owens Corning earnings are bouncing up and down each quarter. Estimates for the next quarter have them at $0.68 per share. On 10/26/11 their earnings were $0.90 per share, increasing the price from $27.24 to as high as $31.29; in one day! Owens Corning is expected to announce its earnings for Q2 on August 1st. Before then we can expect a nice pop in the price of this stock. House sales are still not where they used to be, but OC has got the product for new home builders. At $33.15 OC is a cheap stock and is a great play.

Let me know what you think about OC. Do you think the housing market will pick back up in 2012 or will it  continue to decline?

Follow me on Twitter!

LVS Stock Analysis and Outlook

LVS (Las Vegas Sands) owns and operates casinos in the United States, Macau, and Singapore. When I first researched this stock back in 2010 it was only in the $20s, now it's trading at $52.20. Quite a great investment if you got in back in 2010. But is it still a good stock to get into now? Let's check out the chart below.
LVS chart from www.freestockcharts.com
With the lower trend line we can expect this stock to come down another $4 to the $48 level. According to the Parabolic SAR, this stock is still heading down to a lower price. Parabolic SARs are the white dots above and below the stock price. When the dots are above the price, the stock is in a down trend, when dots are below the stock is in a strong uptrend. The Stochastics, MACD and RSI all indicate this stock is oversold and is ready for more buyers to come in. Stochastics and RSI both show lines moving horizontal and almost turning to the upside, which is a good sign this stock might be ready to head higher. MACD is just about horizontal and may turn soon. When trend lines and indicators all match up, that is your best bet for a great entry point to go long. The trend line is not really set in stone just yet, but if it touches that lower area and turns to the upside along with the indicators, then we have a confirmed trend line set. Also, the 200-day moving average is near the bottom trend line. A $4 drop in price from the current price is a long way and could take a few more days, but if we have confirmation of a turn around with the indicators, then it would be a great time to get in this stock. The near term price of this stock could reach the mid $60s.

LVS has exceeded estimated earnings for the passed 2 years, not including Q1 in 2011, where it missed estimates. Additionally it boosted its revenue to $2.76 billion from prior years earnings, that's a 31% increase from last year. 

What do you think, will it head higher or will 2012 be a bad year for the casino business?
Follow me on Twitter!


Wednesday, May 9, 2012

Is LUXR a great Investment or just another Penny Stock?

All I've been hearing lately is get into "Flash Sales Site" stocks such as AMZN (Amazon) or LUXR (LuxeYard). AMZN is way too expensive, but it's a really great company. LUXR is a really cheap stock, but is it really a great company to invest in? If you haven't heard, LuxeYard is a new members-only site offering customers cheap deals on luxury home items. In fact, LuxeYard is so new that it launched in January, and get this, in April it hit 600,000 members. LuxeYard expects to reach the one million member mark by June. What does that say to me? They're doing something right. It took Facebook about 10 months to achieve 1 million users, while this small Flash Sales site might do it in half the time.
LUXR stock chart showing price, volume, MACD, stochastics and RSI.
LUXR is a penny stock at the price of $1.84 as of today's close. It hit a high of $2.32 on May 8th, that's over 100% and in such a short time. Looking at the chart above we can see that LUXR has hit the lower trend line that I drew in and it has hit the upper trend line perfectly for the passed month. When only paying attention to the lower trend line touch, I would expect the stock price to pop right back up. But when we focus on the other indicators, stochastics, RSI and MACD it tells a different story. With LUXRs recent rally, and its overbought status we can expect the price to come down even lower than what's plotted with the lower trend line; somewhere between $1.40 and $1.60. Don't get me wrong though, no one can predict future stock prices. I use my indicators in the chart to try and predict what's to come in the future; and it is tough to do with penny stocks.

Enough of the technical analysis talk, let's get into what LuxeYard is actually doing that could increase the price of this stock. First off, LuxeYard is acquiring companies left and right to add to its arsenal. Just yesterday LuxeYard acquired LeatherGroups.com, adding more merchandise to its database for sales. The CEO of LuxeYard created an acquisitions team, which can only mean they are eagerly trying to expand their company to make more money. Speaking of acquisitions, LUXR might just be a takeover target itself if it continues doing great things; which would blow this stock up!

So is LUXR a good stock to get in right now? I would say, it is a great opportunity to get into but there is some risk involved. I personally got into this stock yesterday and I am already down some, but I have a strong belief that LuxeYard can stay profitable and grow its business over time. Do your own research and you will be rewarded!

So what do you think, will LuxeYard make profits and drive stock prices up? Are you going to get in early while the stock is still cheap? Let me know in the comments section below.

 LVS stock analysis in my new blog post!

AMRN still your Best Bet - Stock Outlook


I've been in AMRN (Amarin) stock since February and have already made a nice 38% profit. With yesterday's posted Q1 losses, people might think it's time to take profits and run. Before you do that, clear your mind, think and remember. Amarin has got a great omega-3 product called AMR101 that's going to blow away any competitors high triglyceride product. Their studies have proved that it lowers patients high triglyceride levels better than any other products out in the market. I know it's been a bumpy road along the way due to patent issues, but that can't stop this stock, so stick around.

In the past year AMRN has been as low at $6 and has been as high as $19. I can tell you that I made a nice profit in 2011 and I'm looking forward to making an even better profit this year. I like to use stock price history to determine a great entry point in a stock. That's exactly what I did to get in and out AMRN each and every time. While studying a companies stock chart, I like to focus on stochastics, MACD, bollinger bands, RSI, trend lines and candle sticks. See chart below.

Screen shot of AMRN from http://www.freestockcharts.com
Noticing trend lines in a stock is a really great way to determine future stock prices. As of today, AMRN is following a new trend line, due to its recent rally. At the time of this posting, AMRN has been slowly coming down due to its overbought status, according to the stochastics, MACD and RSI reading in the chart. When trend lines are in place we can expect the stock to come down to the $10.70 level, which would give us a good entry point. When looking at the bollinger bands, we can see that the bubble is expanded and this is not a good sign; we can expect the stock price to drop more. When the top line and bottom line of the bands are more contracted, there is a better chance for AMRN to shoot back up as it did the previous two times. Another good sign that this stock is in an uptrend is that the 50-day and 200-day moving average is below the current stock price.

Within a few days, there's a possibility AMRN will come down even further from the current $11.48 price to around the $10.70 level. Once it hits that level, we can expect a nice rally back up where this stock belongs; around $13 (short term price target). AMRN is also a potential take over target due to its great product, so look out for that. Banks have put a $24 price target on AMRN, so get in while it's still a bargain!

New article on stock ticker symbol LVS.
New article on stock ticker symbol LUXR.

Follow me on Twitter!